Temperature Analysis
Here we study an annual temperature chronicle (somewhere near Paris, France) and exhibit the strong pseudo periodical nature of the signal that is due to the day/night cycle.
First download the temperature chronicle in Matlab file format. Then load the data into memory
load sollicitations;
There is much data that is not required here; we will only keep the time signal and the temperature signal
myTime = data(:,1);
myTemp = data(:,2);
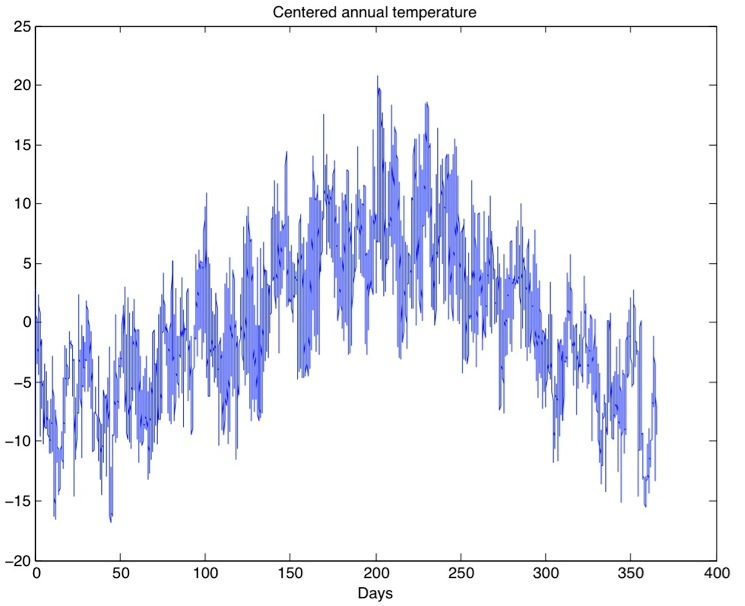
and we plot the temperature with the x axis labeled in days, knowing that the sampling interval for the temperature is one hour, but the value of the time is in minutes.
centerTemp=myTemp-mean(myTemp);
figure(1);
oneDay=(3600*24);
plot(myTime./oneDay,centerTemp);
title('Centered annual temperature')
xlabel('Days');