Fourier Analysis
We first compute the FFT of the signal and display it
y = fft(extract);
figure(3); MinesMagPlotFFT(y,Fs);
(you did write MinesMagPlotFFT previously!)
Here is the plot
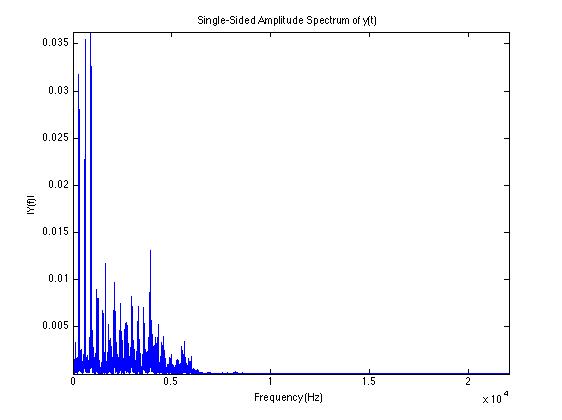
If you remember the exercise on the temperature, you know how to extract the frequency that corresponds to the dominant spike. We will use this later.
Now you will program the following function, which extracts the dominant frequencies of the signal and return the sorted frequencies and magnitudes according to the descending order of the magnitudes:
function [freqs,amps] = sampleSound(theSound,numFreq,Fs);
% samples the numFreq frequencies of largest amplitude
% in the FFT of theSound with sampling frequency Fs
% and return the vector of amplitudes
% (in descending order) and the corresponding vector of frequencies
Use your experience of the temperature exercise to program this. You will normalize the amplitudes so that the largest of them will be one.