Frequency separation
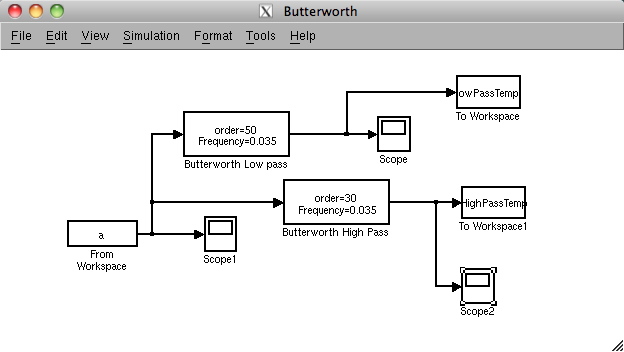
With the help of the Butterwoth filters, we will separate the intra day and the inter day variations of the temperature. To do so, we will use Simulink, which provides a graphical interface to analog simulation. The Simulink model will look like this
To invoke Simulink, type Simulink in the command window, on click on the Simulink icon ![]() in the toolbar. Help on Simulink is available in the online help
in the toolbar. Help on Simulink is available in the online help
This model fetches data from the workspace (the "From Workspace" block) and send the output back the workspace (the two "To Workspace") blocks. By contrast to Matlab, Simulink always "lives" in time, which means that in and out data includes a time clock. This makes the I/O to the workspace a bit cumbersome (because we have regularly sampled data here) if you are not used to it, and therefore we provide you with two scripts that will pre process data for input and post process for output.
Input preparation
% prepare temperature for simulink
load sollicitations;
myTime = data(:,1)/3600; % in hours
myTemp = data(:,2);
myTemp = myTemp-mean(myTemp);
figure;plot(myTemp);
a = [myTime myTemp]; % goes to simulink
so that the input block can use the variable a as a valid input.
Output post processsing
lowPassTemperature = lowPassTemp.signals.values;
HighPassTemperature = HighPassTemp.signals.values;
figure;plot(lowPassTemperature);
title('Day to day low pass component of the temperature')
figure;plot(HighPassTemperature);
title('Intra day high pass component of the temperature')
with lowPassTemp being the chronicle sent by Simulink in the upper block and HighPassTemp being sent to the lower block.
The scope blocks display their input data.
The two most complicated blocks are the filter blocks. More on this on the next page.